Introduction
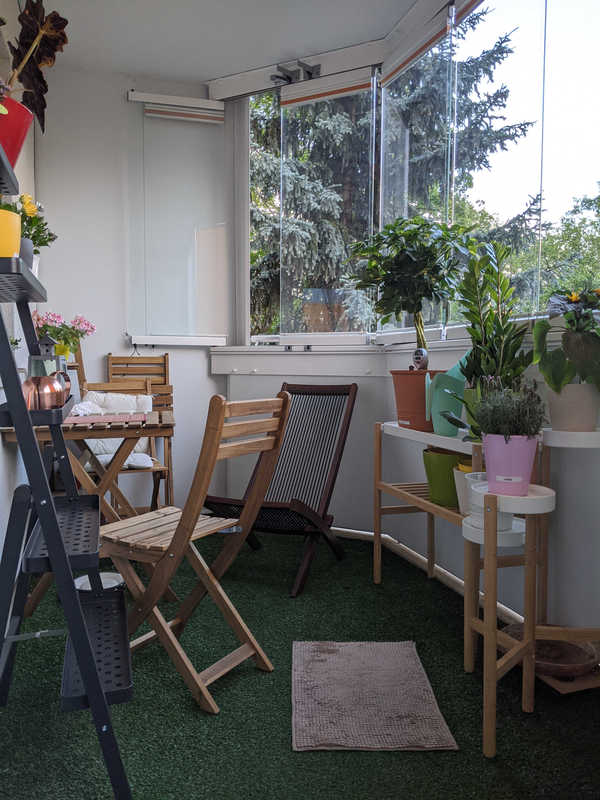
A few weeks ago I had a few days off and, as I will most probably spend my summer vacations in Balconia I started a little non-IT (ahem!) project to set-up my balcony as a green oasis for the summer:
- A little table and two chairs
- A comfortable chair to lie in the sun
- A rack and side-board for plants
- A few plants
As I don’t have a green thumb, plants are of course somewhat risky, so I decided that I needed some indicator to help me understand when my plant need water and minerals. This post is about where that brought me.
There is a whole ecosystem around plants so I decided to order two devices for testing:
- An analog display that measures humidity, soil Ph and light
- A Bluetooth LE device that measures humidity, light, temperature and soil minerals, and displays it in an app
I could also have gone down the rabbit-hole of DIY sensoring and watering with Arduino but I decided not to, at least for now…
Devices and ecosystem
Analog display
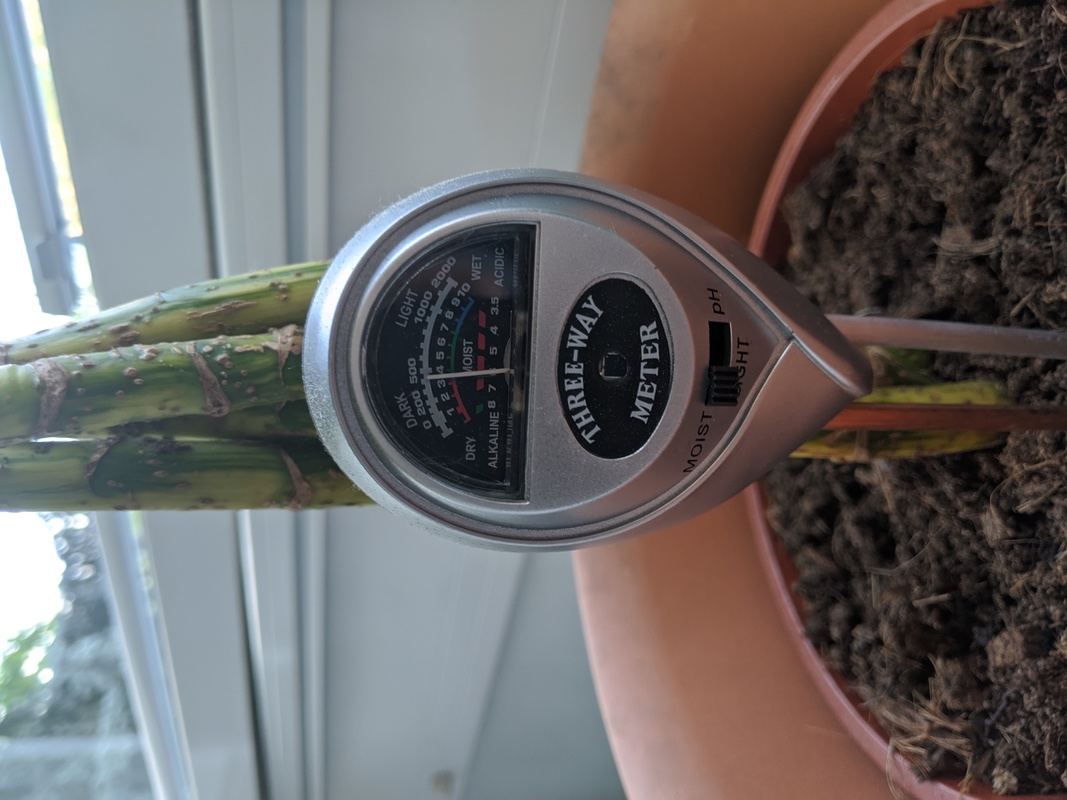
The analog device is pretty straight-forward, and it comes without an ecosystem: it has a display and you can switch it between different modes, to display humidity, light and the Ph. It also comes with a sheet where reference values for different plants can be read from. Nothing fancy, it does the job but that’s not for me :)
Bluetooth LE devices
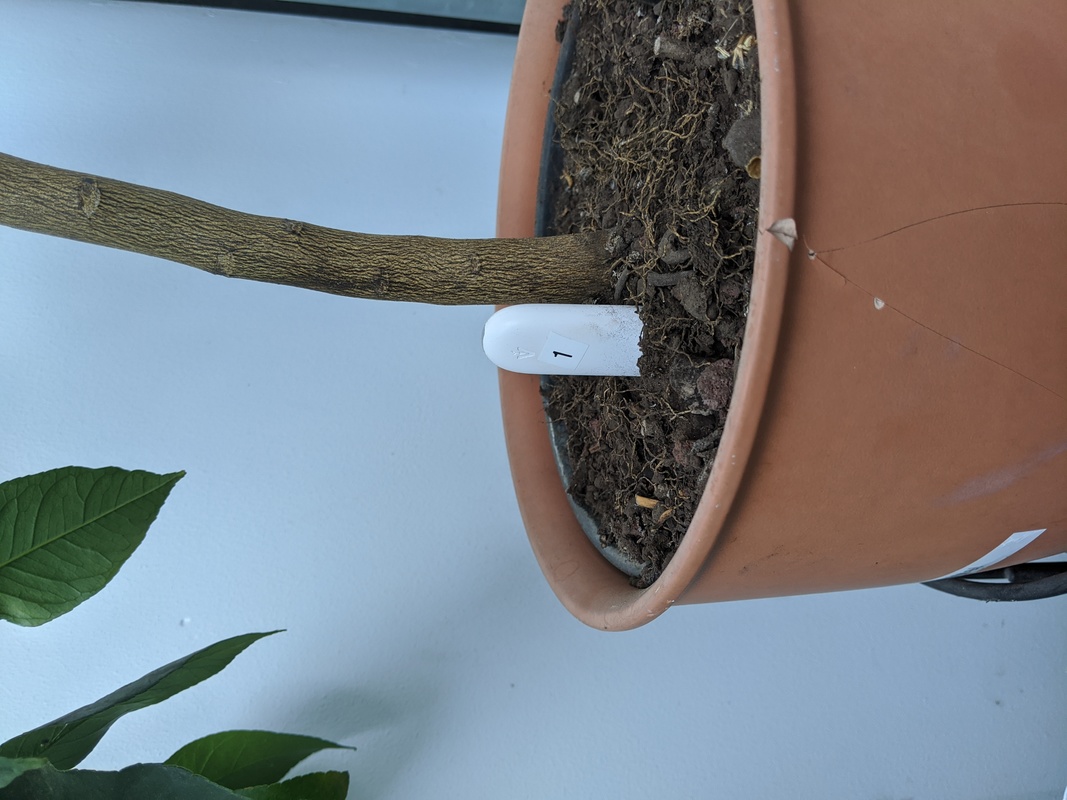
The Bluetooth LE devices are pretty expensive, and they come at different price-points on Amazon, depending on how long you are willing to wait.
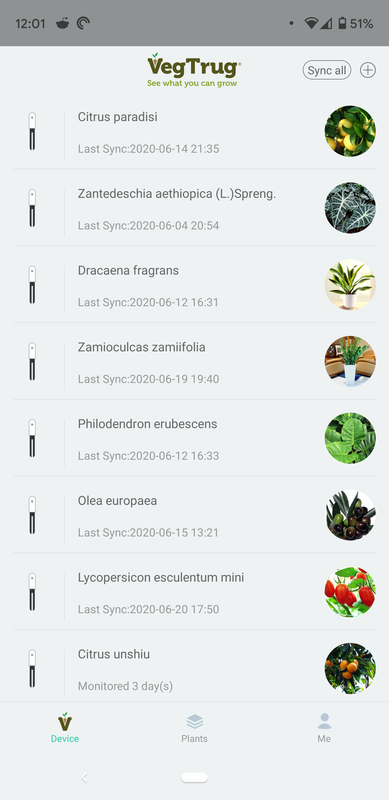
They come with an Android and iOS App called “VegTrug Grow Care”. Later I learned that these sensors are compatible (knock-offs?) of the Xiaomi MI Home sensors.
The intelligence of course lays in the ecosystem: the app. You use it to activate the sensors but it also comes with a pretty complete database of plants, with the definition of thresholds, historical data and tips on how to take care of your plants: pretty much everything I need…
Hackability
I think you have guessed it by now: I am all-in with the BLE ecosystem. I have my app all set-up and configured with my plants, so what comes next?
Extracting sensor-data
As I mentioned, the key is that the sensors are compatible with the “Xiaomi MI Home” sensors, and guess what? there are some libraries for those, for example the Python miflora library.
So it didn’t take me long to hack some code together, running on a Raspberry PI 3, to poll the data. The code is open sources under the MIT license and can be found here.
What it does it that it queries the sensors based on a list of the BLE MAC addresses, retrieves the interesting and relevant data (battery, firmware version, temperature, light, moisture, conductivity), and puts it into a time-series database (InfluxDB).
Database design
Time-series database are a little strange at first, so I will share the schema I use. It can be expressed a a JSON object:
    json_body = [ \
      {"measurement": "plant_sensor", \
      "tags": {"id": item['id'], "plant": item['plant'], "mac": item['mac']}, \
      "time": now, \
      "fields": { \
          "battery": poller.battery_level(), \
          "temperature": poller.parameter_value('temperature'), \
          "light": poller.parameter_value('light'), \
          "moisture": poller.parameter_value('moisture'), \
          "conductivity": poller.parameter_value('conductivity') \
      }}]
- The database (
measurement) is calledplant_sensor - The fields are all numeric values:
battery,temperature,light,moistureandconductivity - The tags (for filtering the data) are an
id, the name of theplant, itsmacaddress - And as it is a time-series
timeshould not be missed
The way you should think of time-series databases is:
- put what you will be filtering on in the
whereclause into tags - the fields are the data you want to represent, i.e. the values
- push the data in the right (time) order to the database, in UTC time. Conversions to local time will happen at the display layer
Leveraging sensor-data
I am into Kubernetes so it should be no surprise that I run the InfluxDB instance on my Kubernetes cluster, and the same goes for Grafana on Kubernetes as well. My home-cluster is composed of 5 Raspberry PI 4, running k3s on Ubuntu 20.04 64 bits.
I will not go into setting-up Grafana and InfluxDB in this post as it is pretty straight-forward: I use the official Helm charts to install both.
If you are interested in the details of the setup, especially in regards to arm, let me know.
Data source
Obviously if you want to query data in Grafana you need a data source. InfluxDB is available out-of-the-box in Grafana so the configuration is just about entering the URL of your InfluxDB database.
Queries
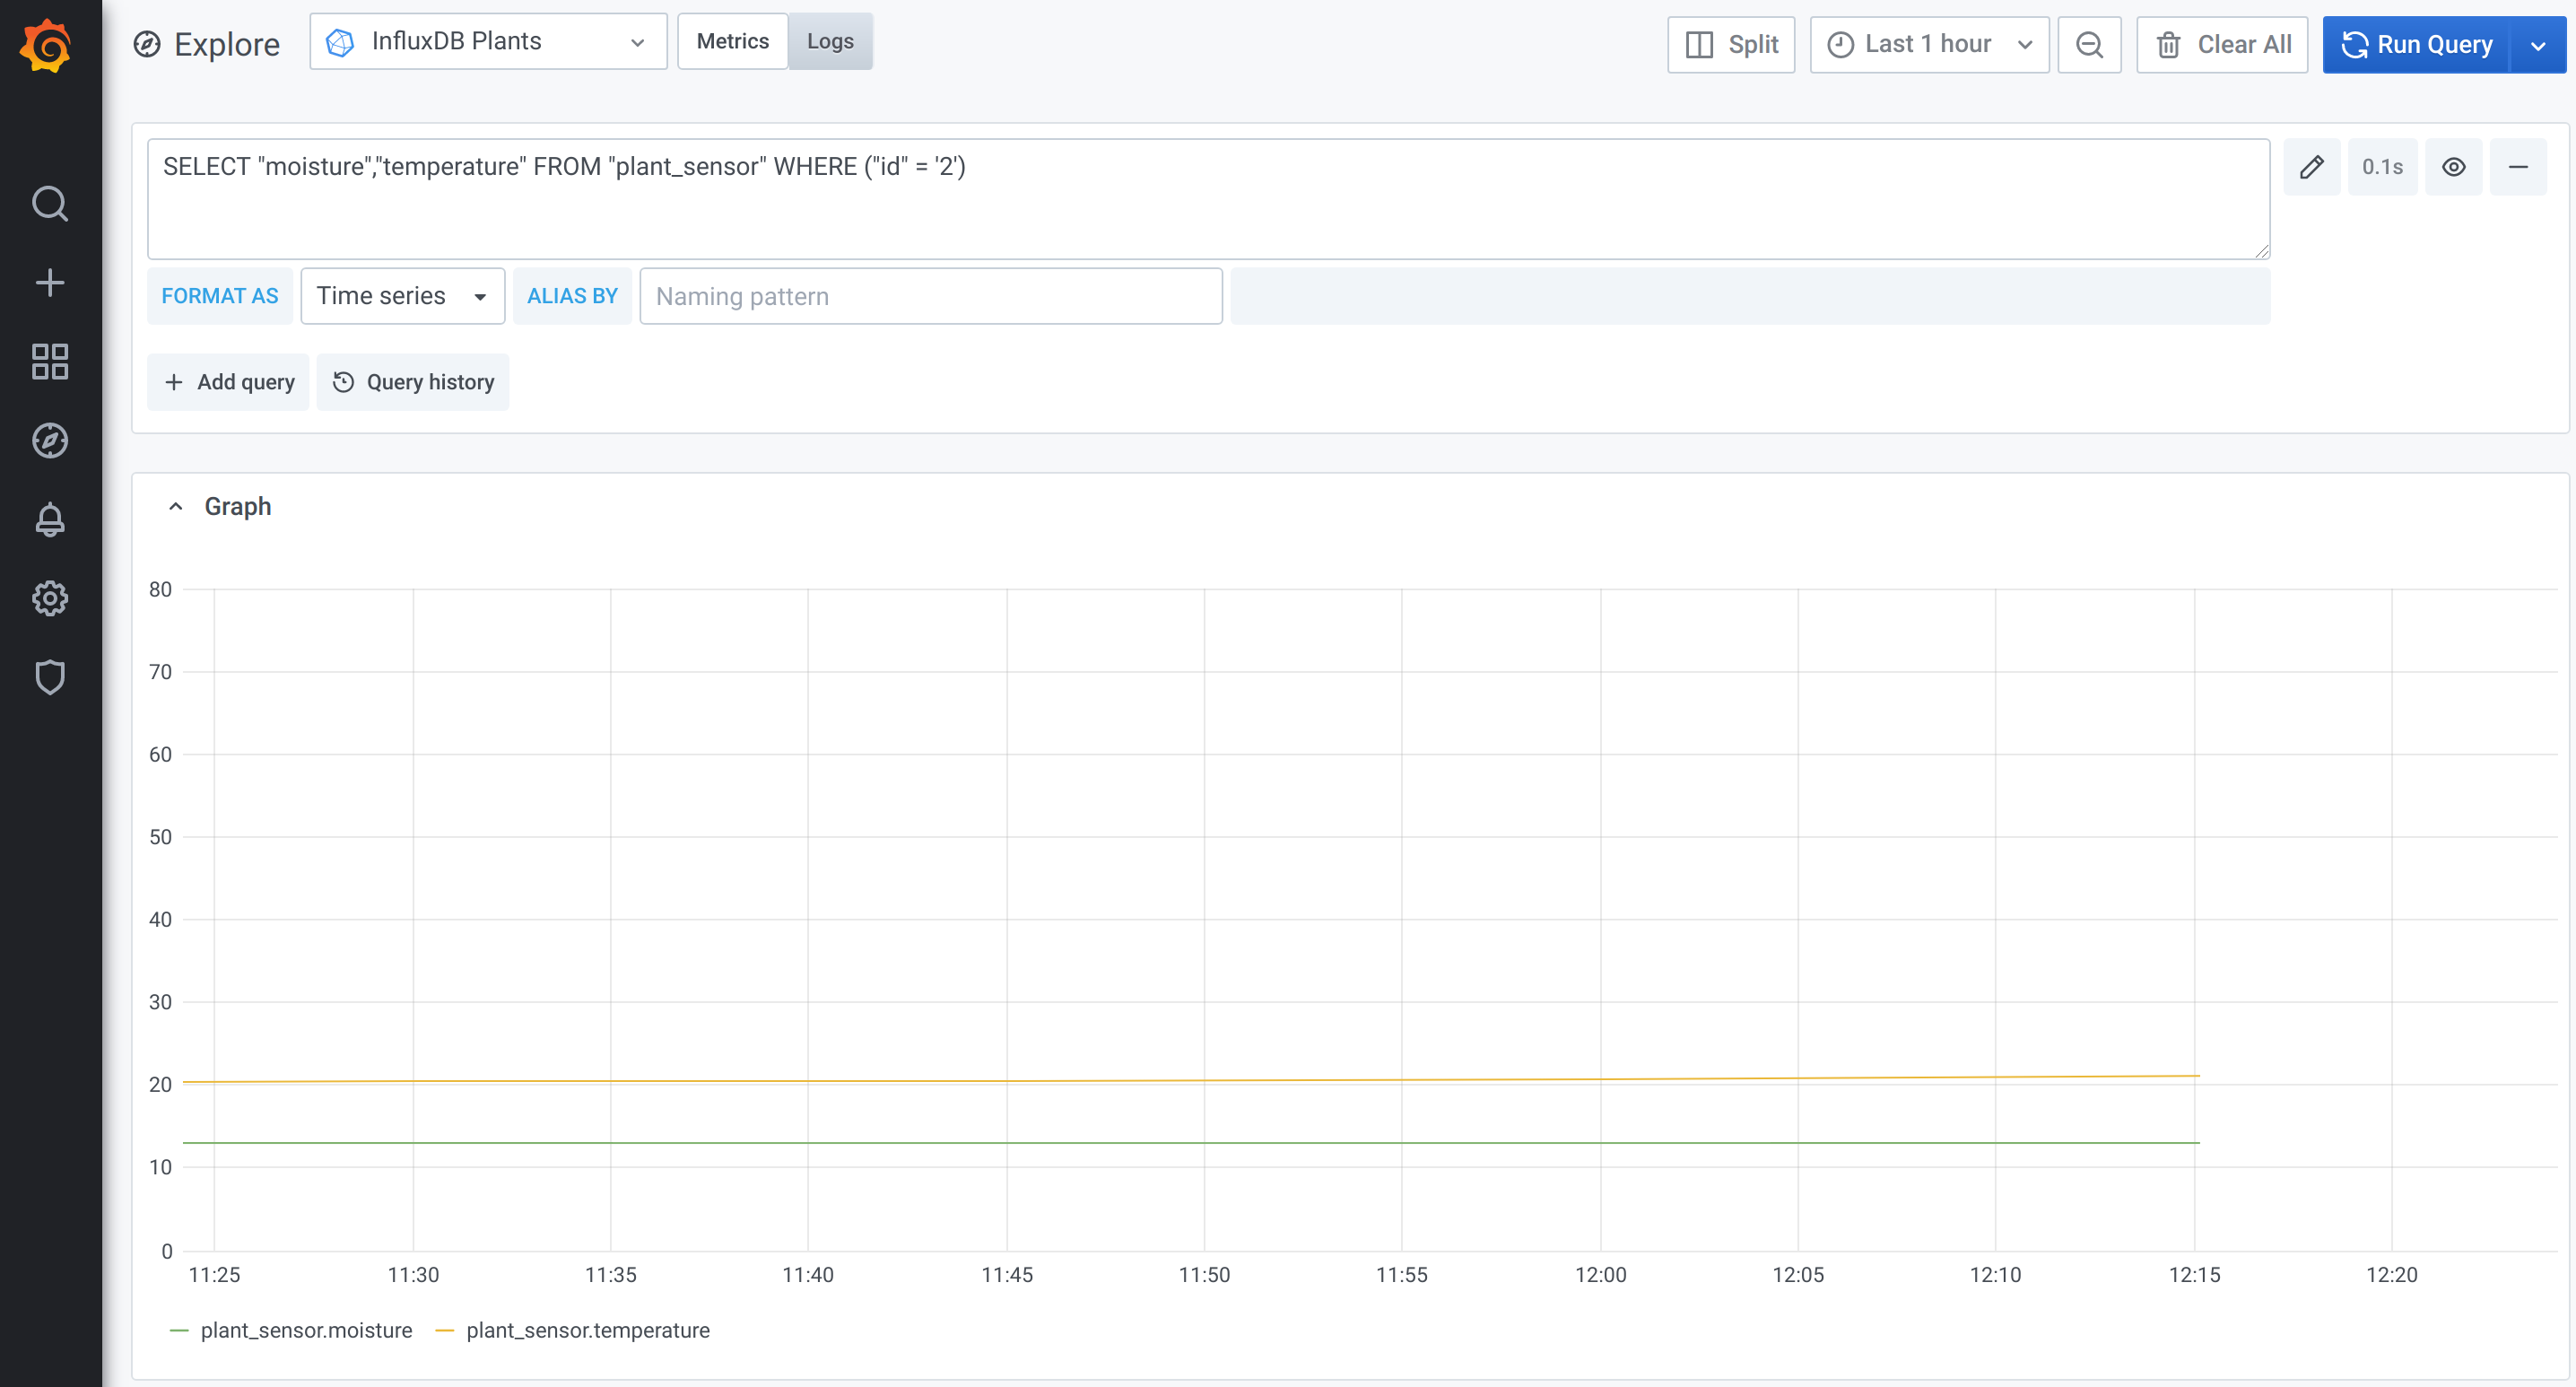
To get acquainted with the data I recommend the “Explore” mode in Grafana. You can use it to connect to the data source and query the data that you have uploaded.
For example:
SELECT "moisture","temperature" FROM "plant_sensor" WHERE ("id" = '2')
will show a graph of the moisture and temperature of plant #2:
Dashboards
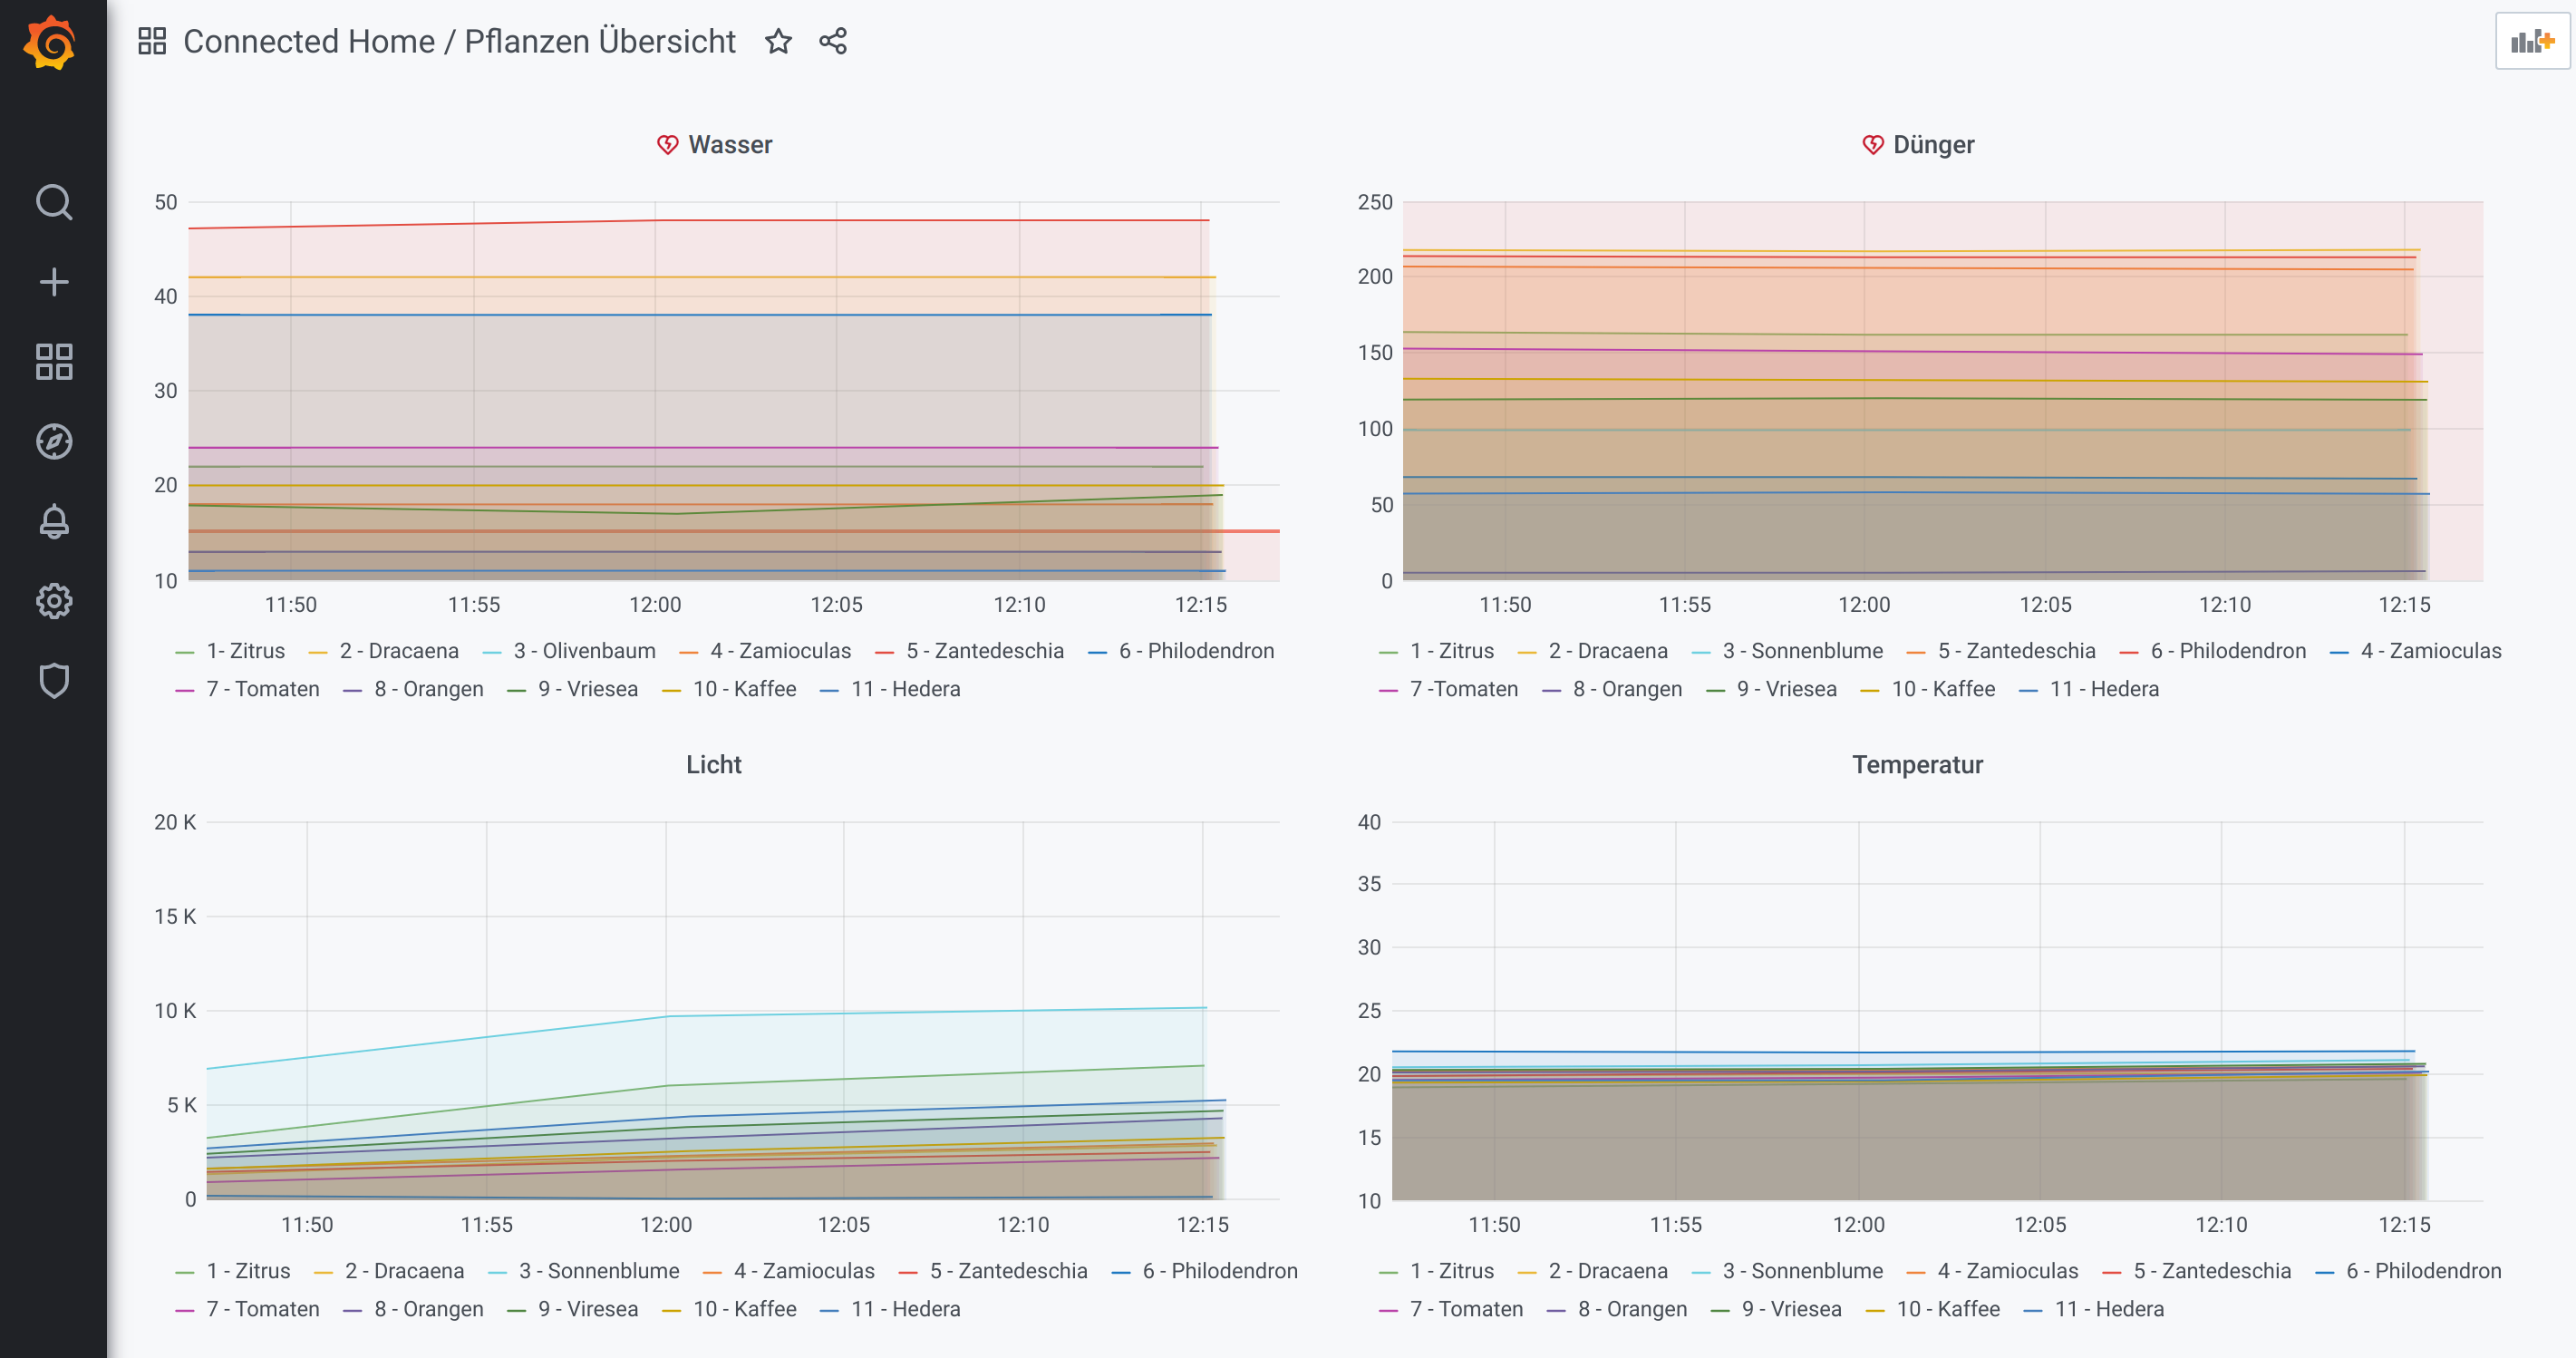
I have built two dashboards for my plants:
An overview of each field moisture, temperature, light, and conductivity, for all plants:
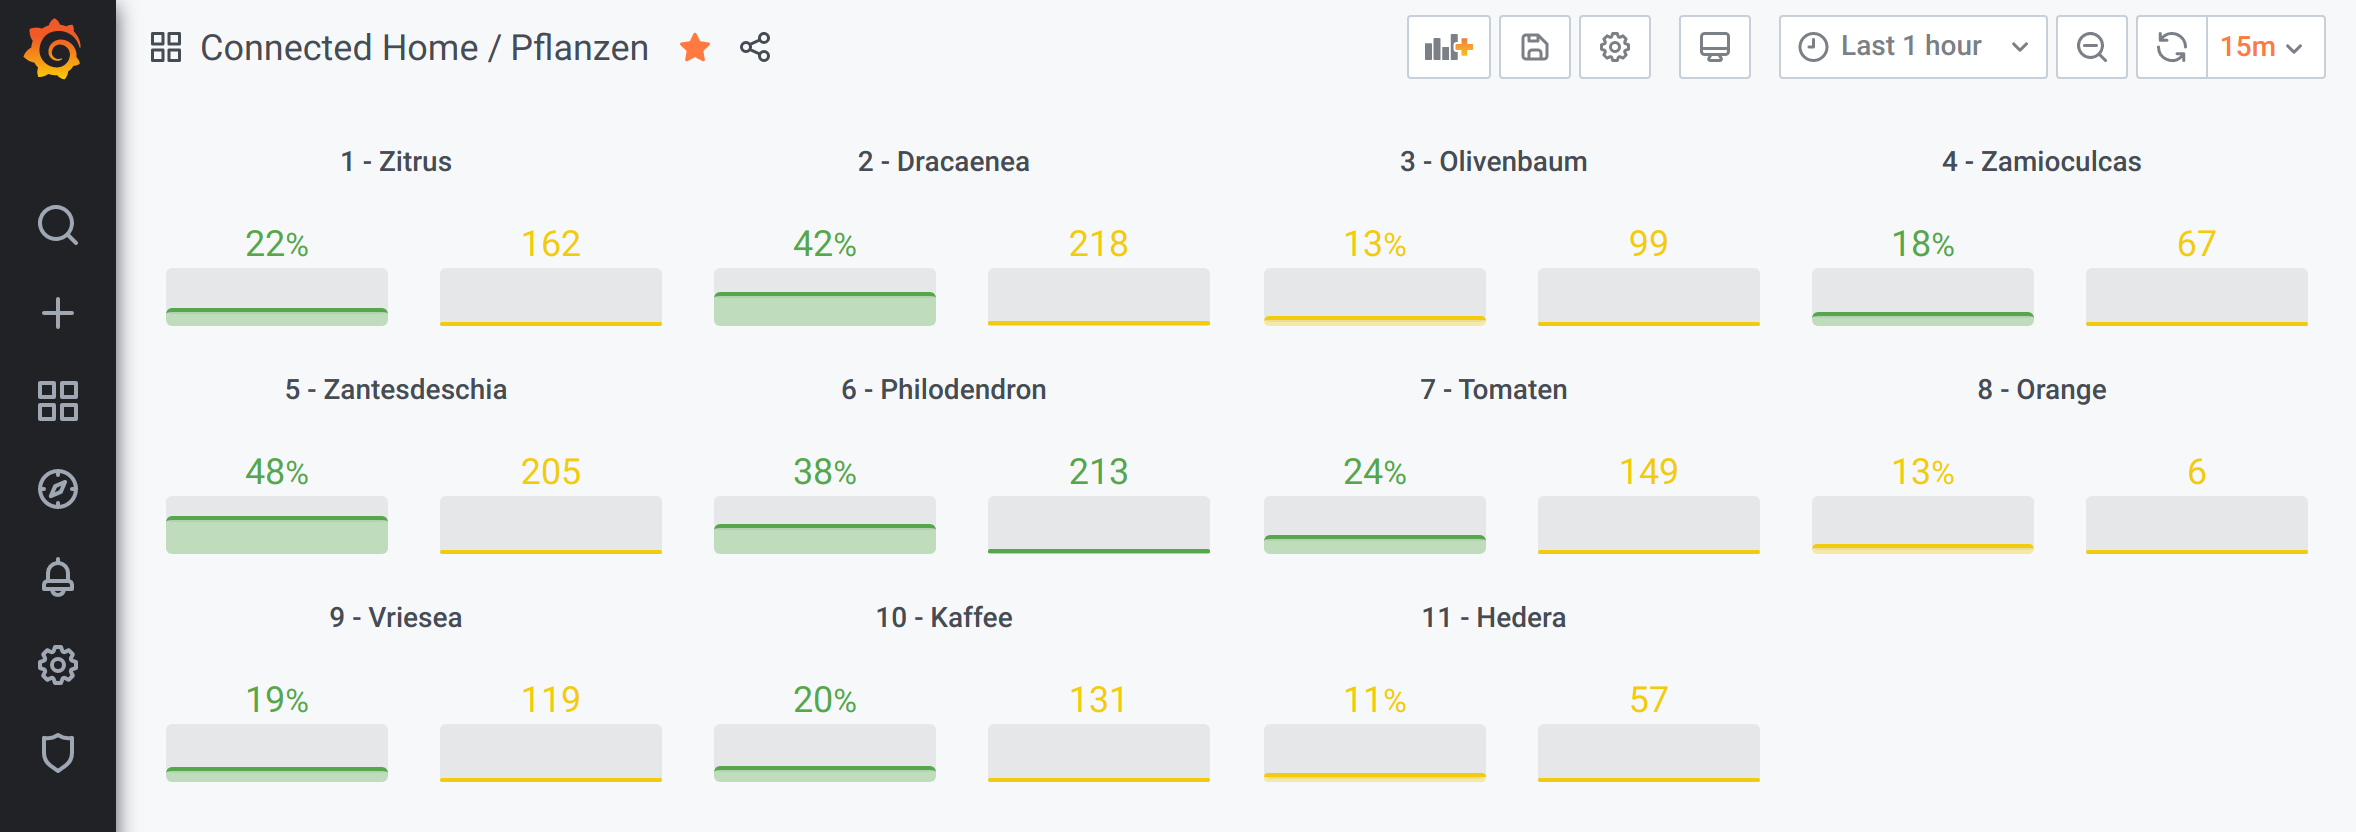
An actionable overview of moisture and conductivity for each plant:
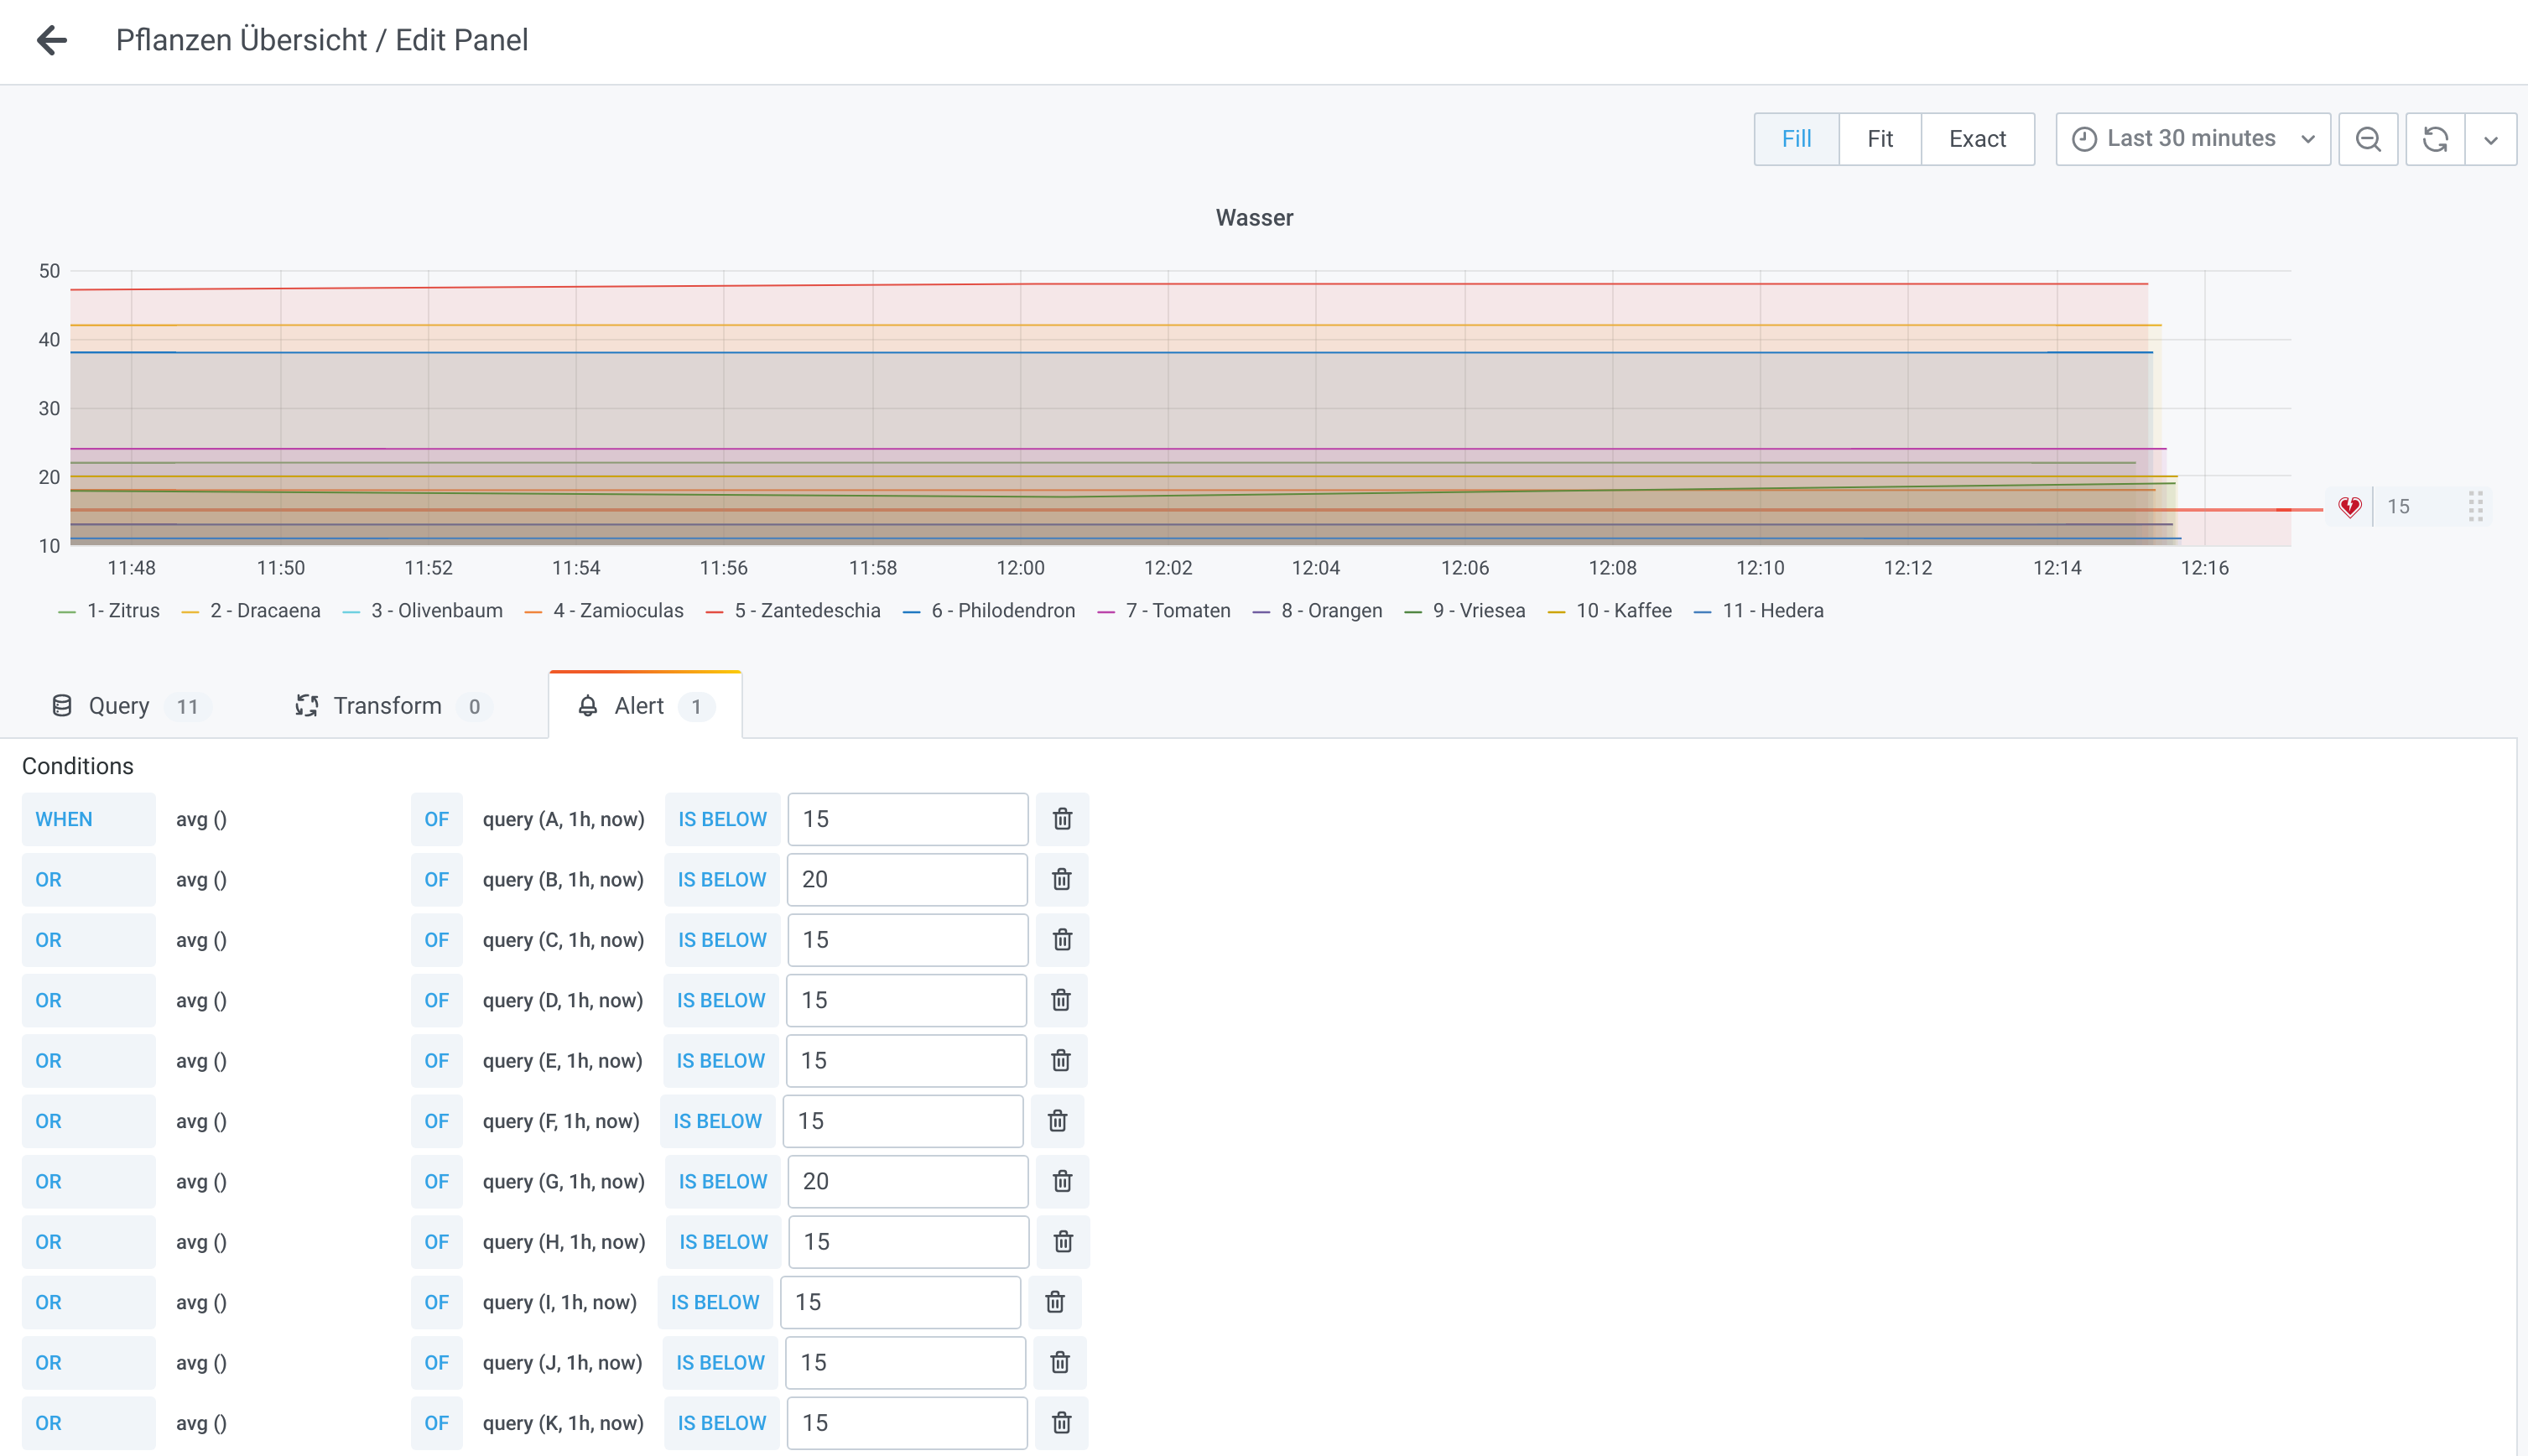
Alerts
Grafana also comes with alerting so it is pretty easy to send define alerts when thresholds are reached. I do this on moisture and conductivity. The thresholds come from the “Veg Trug” app, and are specific to each plant.
Rounding-up the experience
To complete the user experience I have built a physical dashboard, based on a Raspberry PI 3 with a 7" screen.
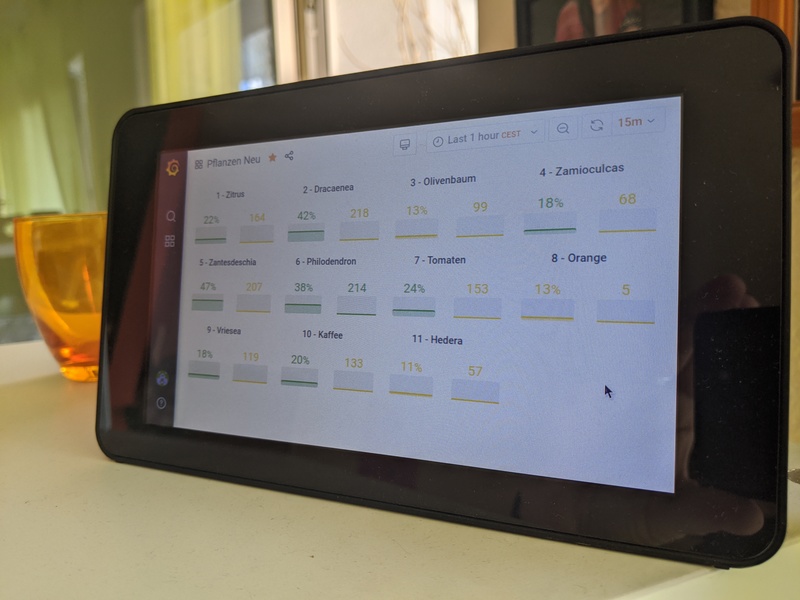
The Rpi runs Raspbian with auto-login, Chromium opening-up at startup, showing the “Plants” dashboard.
Alerts are sent by mail to all family members so that everyone is aware when the plants need to be serviced.
Shopping-list
- Analog sensor
- BLE sensor
- 7" screen with Raspberry PI 3 bundle
- Power adapter for Raspberry PI 3
- 64GB microSD card
Future
For the future I have plans to:
- add more data to the dashboard, e.g. the data I collect from the Mobile Alerts sensors by Techtronic. Fortunately these are hackable too ;)