Introduction
Have you ever read an article and thought: I want to build this?
Well that happened to me while reading Geolocating SSH Hackers In Real-Time, so I decided to build it.
I am into Kubernetes these days so I decided that I would host the showcase on my Kubernetes lab environment:
- I run a Proxmox server with 64 cores and 256 GB of RAM, that is reachable over ssh from the internet (pub/priv-key login only). This is perfect for implementing this showcase as and username/password auth attempt fails anyway
- My production Kubernetes cluster has two ingress controllers and one of them is reachable only internally: this is perfect to expose Grafana
The end result (TLDR;)
The final architecture looks like this:
    ----------------------
   | (4) Grafana Dasboard |
    ----------------------
             ^
             |
    ----------------------
   | (3)    InfluxDB      |
    ----------------------
             ^
             |
    --------------------
   | (2) Log Collector  |
    --------------------    Kubernetes
             ^
             |              -----------
    ---------------------
   | (1)     syslogd     |    Host OS
    ---------------------
- syslogd forwards all log entries related to failed login attempts to (2), passing the IP as parameter
- The login collector gets called each time a login attempt fails. It resolves the IP address into coordinates and stored the login attempt with the timestamp and its location in InfluxDB
- InfluxDB persists the login attempts and exposes a datasource to Grafana
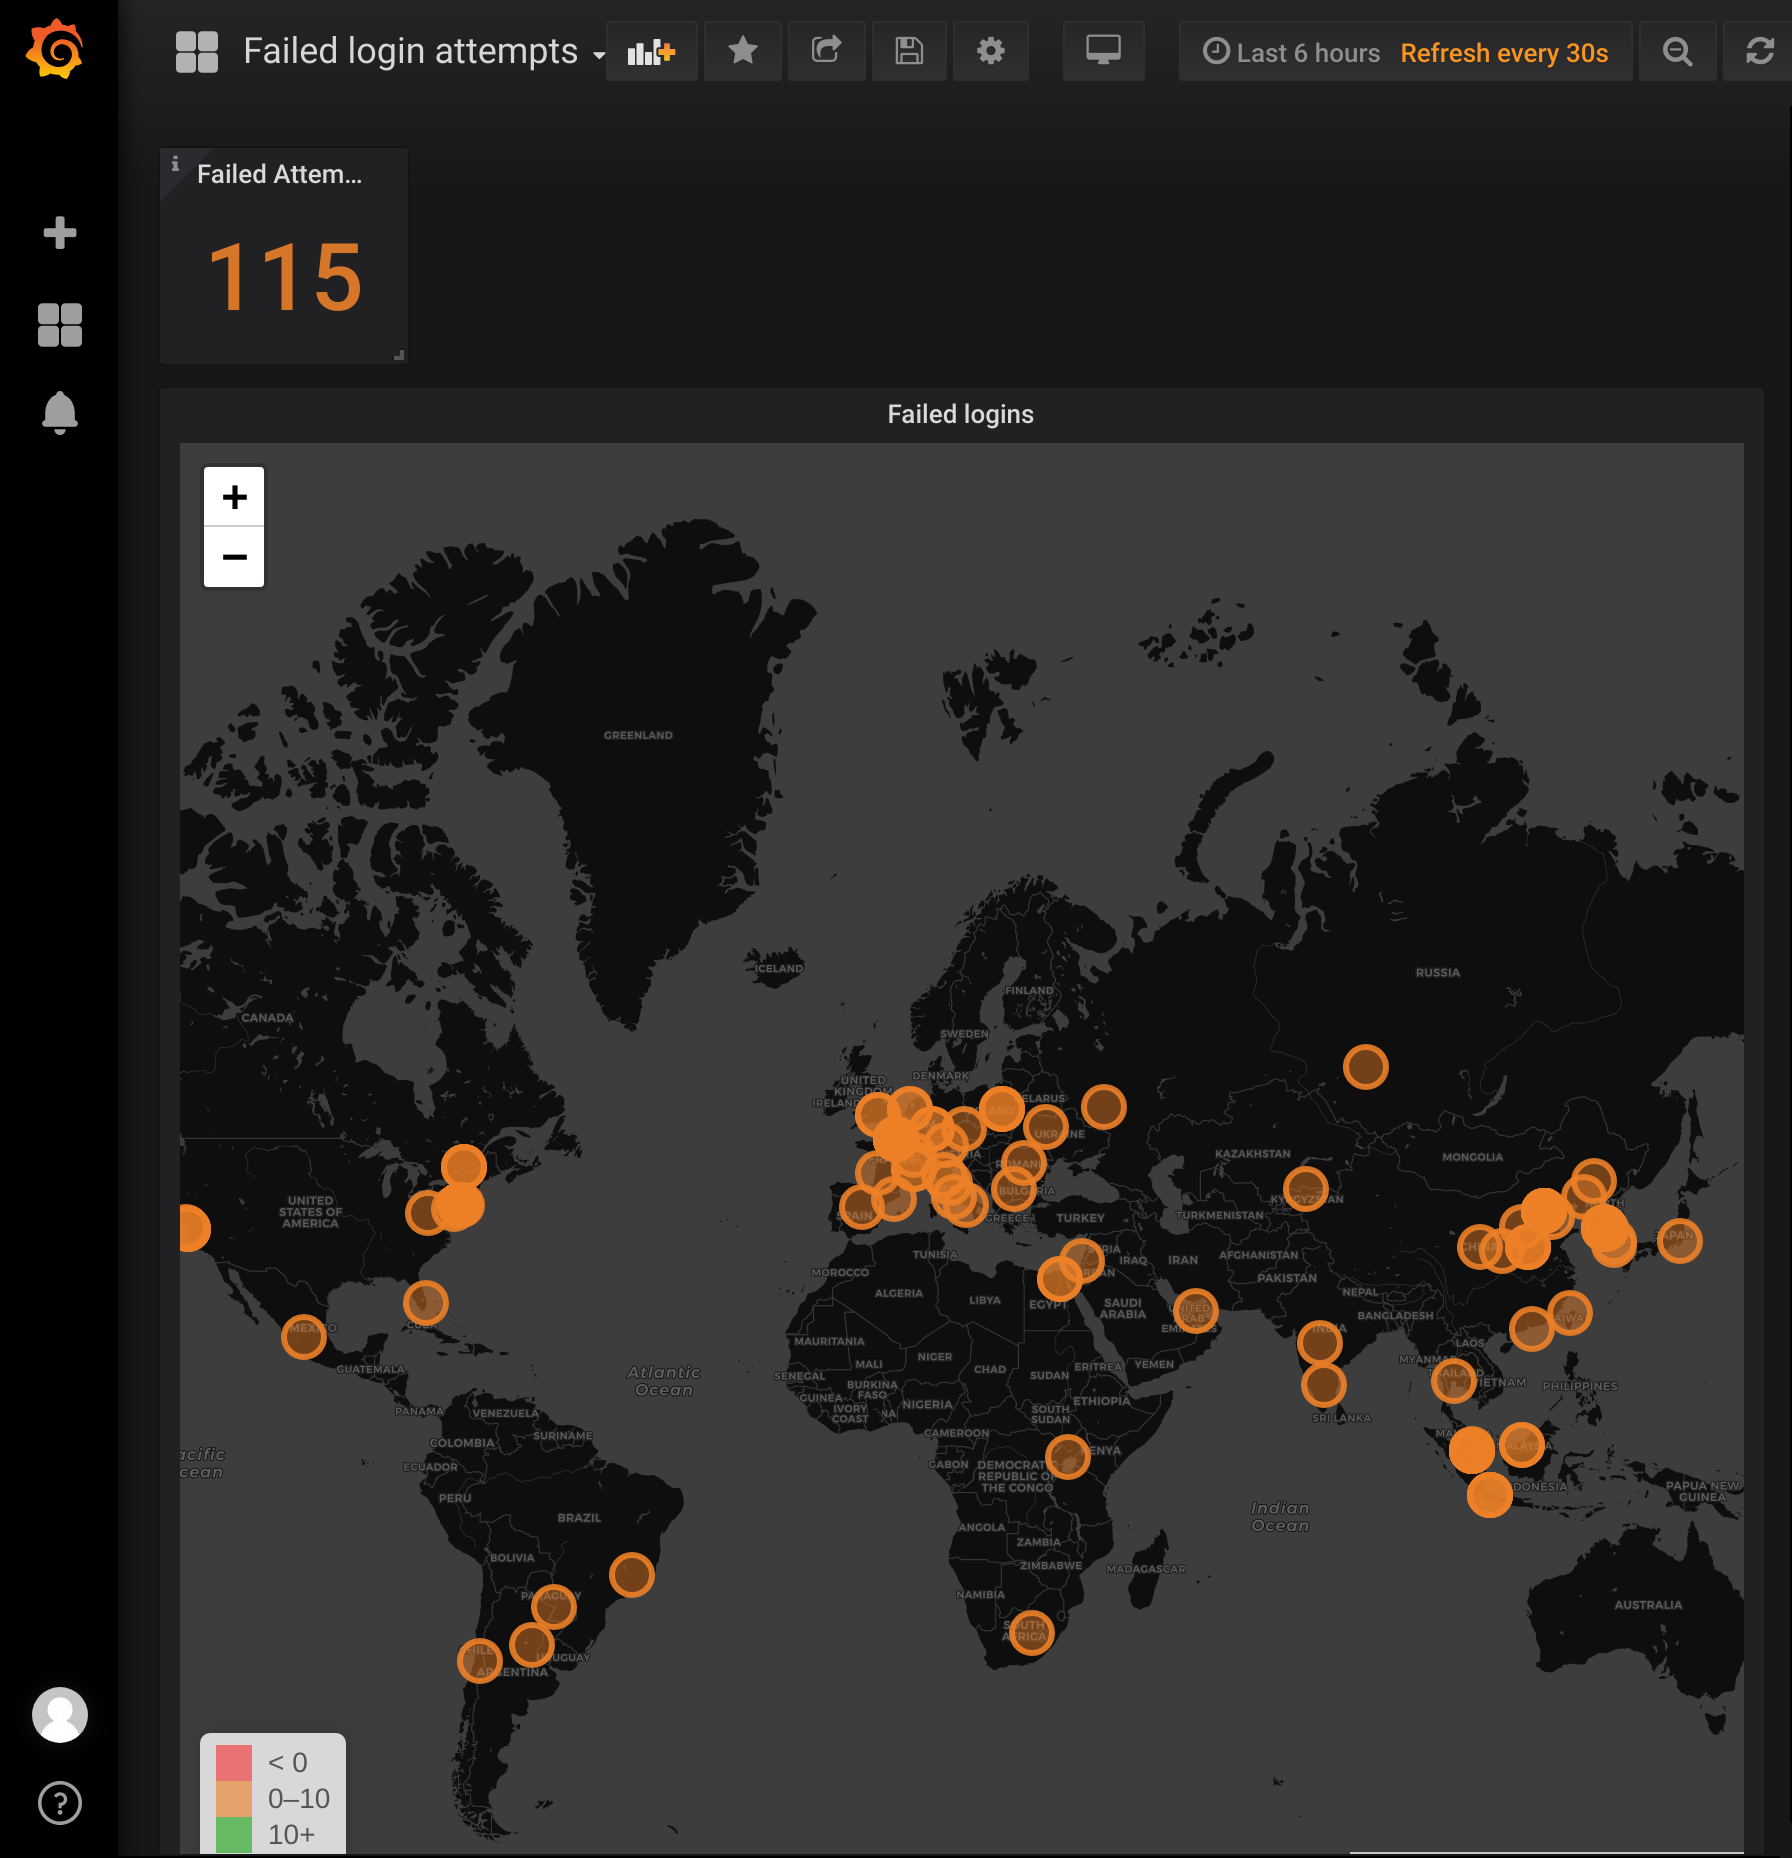
- The Grafana dashboard draws the data from InfluxDB and shows the attempts to hack the server: failed login attempts
The final result from an end-user perspective looks like this:
How I got there
We will proceed in a different order from top to bottom so that we can test the chain when syslogd’s forwarding is enabled. All details as well as the source code can be found here
InfluxDB
Install
The setup of Influxdb is pretty straight forward using helm, based on a slightly modified values.yml.
helm install --name influxdb -f ./values/influxdb/values.yaml stable/influxdb --namespace influxdb
Done!
The influxdb user is admin and you can retrieve the auto-generated password with: kubectl -n influxdb get secret influxdb-influxdb-auth -o jsonpath="{.data.influxdb-password}" | base64 -d
Create the database
We will use the influxdb cli to connect and create the database login-attempts.
First, retrieve the password:
export PASSWORD=$(kubectl -n influxdb get secret influxdb-influxdb-auth -o jsonpath="{.data.influxdb-password}" | base64 -d)
Then forward the local port 8086 to the influxdb pod:
kubectl port-forward --namespace influxdb $(kubectl get pods --namespace influxdb -l app=influxdb-influxdb -o jsonpath='{ .items[0].metadata.name }') 8086:8086
connect to InfluxDB:
influx -host 127.0.0.1 -port 8086 -username admin -password $PASSWORD
and finally create the database:
create database "login-attempts" with duration 30d
Grafana
Install
Here again we will use helm:
helm install --name grafana -f ./values/grafana/values.yaml stable/grafana --namespace grafana
and retrieve the password (the username is admin):
kubectl get secret --namespace grafana grafana -o jsonpath="{.data.admin-password}" | base64 --decode ; echo
To expose grafana to the network we need an ingress and there are two ways to deploy that kubernetes object:
- let helm create the ingress by setting
ingress.enabledtotrueinvalues/grafana/values.yaml - Deploy an own ingress: this is the way I prefer to do things because I use Traefik as an ingress controller on my Kubernetes cluster, that takes care of generating Let’s Encrypt certificates automatically for any new ingress. Aside from that I did not want to expose Grafana to the internet so I added a
whitelist-source-rangedefinition to the ingress to make sure that Grafana only accepts incoming traffic coming from my local network.
To create the ingress using Traefik:
- Edit the hostname in
manifests/grafana/ingress.yaml - Deploy the ingress:
kubectl -n grafana apply -f manifests/grafana/ingress.yaml
Add Worldmap Panel
Next we will add the Worldmap panel to Grafana.
- connect to the grafana pod:
kubectl -n grafana exec -it $(kubectl get pods --namespace grafana -l app=grafana -o jsonpath='{.items[0].metadata.name}') /bin/bash - Install the panel:
grafana-cli plugins install grafana-worldmap-panel - Force the pod to restart:
kubectl -n grafana delete pod $(kubectl get pods --namespace grafana -l app=grafana -o jsonpath='{.items[0].metadata.name}') - Wait for grafana to restart and verify that the panel is available: click “Add Dashboard” and check that the “Worldmap Panel” is available
Add InfluxDB datasourcenfluxdb
- Go to “Configuration - Datasources” and select “Add Datasource”
- Select “InfluxDB”
- Name the datasource
InfluxDB - Add the cluster internal URL:
http://influxdb-influxdb.influxdb.svc:8086 - Enter the database name:
_internal(the default database) - Add
adminand his password as credentials - Hit save and test: you should see a positive test-result
The log collector
Create an ipstack.com account
The tcp listener uses ipstack.com to resolve IPs to geohashes.
1. Register a free account at
ipstack.com1. Grab your API key and add it to config.json
Update 2019-03-31: I reached ipstack.com’s quota of free api-calls far too soon so I moved to the free (for non-commercial use) ip-api.com.
Build and deploy
The log receiver is a tcp socket listener written in nodejs that will get called from rsyslogd.
We will deploy it as container to Kubernetes, and expose it through a nodePort (we can not use an ingress as the communication will happen over tcp, not http):
- Build the container:
docker build -t <your-dockerhub-name>/logincollector:<tag> - Push the container:
docker push <your-dockerhub-name>/logincollector:<tag> - Change the deployment in
manifests/logincollector/deployment.yamlaccording to your docker image - Create the namespace:
kubectl create ns logincollector - Deploy:
kubectl -n logincollector apply -f manifests/logincollector/
You should see the following output:
deployment.apps "collector-deployment" created
service "collector-svc" created
Now get the details of the service: kubectl -n logincollector get svc
That should display something like this:
NAME            TYPE       CLUSTER-IP     EXTERNAL-IP   PORT(S)          AGE
collector-svc   NodePort   10.97.41.164   <none>        8080:31829/TCP   40s
Where 31829 is the node port that is exposed on each cluster node. We will need this port to configure the log shipping in the rsyslogd config.
syslogd
Find out the log pattern we are looking for
On the node running sshd check the result of less /var/log/auth.log | grep ssh. The output may look like this:
Feb 20 11:59:55 pve sshd[31596]: Invalid user netflow from xxx.xxx.xxx.xxx port 48854
Feb 20 11:59:55 pve sshd[31596]: Invalid user netflow from xxx.xxx.xxx.xxx port 48854
[...]
Feb 20 12:01:36 pve sshd[31816]: Disconnected from xxx.xxx.xxx.xxx port 33903 [preauth]
Your log may look different so you may have to adapt the patterns. What we are looking for here is: Invalid user netflow from xxx.xxx.xxx.xxx port 48854, so a less /var/log/auth.log | grep ssh | grep " Invalid user" will show the list of login attempts we are looking for.
Create the rsysdlog rules
Edit /etc/rsyslog.d/50-default.conf and add:
#  Default rules for rsyslog.
#
#                       For more information see rsyslog.conf(5) and /etc/rsyslog.conf

#
# First some standard log files.  Log by facility.
#

if $programname == 'sshd' then {
   if $msg startswith ' Invalid user' then {
      # Transform and forward data!
      action(type="omfwd" queue.type="LinkedList" action.resumeRetryCount="-1" queue.size="10000" queue.saveonshutdown="on" target="192.168.178.72" port="31829" protocol="tcp" template="ip-json")
   }
#   stop
}

auth,authpriv.*                 /var/log/auth.log
*.*;auth,authpriv.none          -/var/log/syslog
#cron.*                         /var/log/cron.log
#daemon.*                       -/var/log/daemon.log
kern.*                          -/var/log/kern.log
#lpr.*                          -/var/log/lpr.log
mail.*                          -/var/log/mail.log
#user.*                         -/var/log/user.log
What this script does is pretty straight forward:
if $programname == 'sshd' then {filters for log entries coming fromsshdif $msg startswith ' Invalid user' then {describes the entries we are lookging for (see 4.1.)action(type="omfwd" target="<your-kubernetes-node-ip-goes-here>" port="<your-nodeport-goes-here>" protocol="tcp" template="ip-json")uses theomfwdforwarder to send log entries as tcp packets (seeprotocol) to the IP defined intargetand to the port defined inport- additional options to the
actionmake sure that no message is lost template="ip-json"describes the format of the tcp packet that we are going to define in the next step
Create the message template
Still on the node running sshd, edit /etc/rsyslog.d/50-default.conf and add:
# We handle "Invalid user q from xxx.xxx.xxx.xxx port 10664"
template(name="ip-json" type="string" string="{\"username\":\"%msg:R,ERE,1,DFLT:^ Invalid.*user ([a-zA-Z]*).* ([0-9][0-9]*[0-9]*.[0-9][0-9]*[0-9]*.[0-9][0-9]*[0-9]*.[0-9][0-9]*[0-9]*).* port ([0-9]*)--end%\",\"ip\":\"%msg:R,ERE,2,DFLT:^ Invalid.*user ([a-zA-Z]*).* ([0-9][0-9]*[0-9]*.[0-9][0-9]*[0-9]*.[0-9][0-9]*[0-9]*.[0-9][0-9]*[0-9]*).* port ([0-9]*)--end%\",\"port\":\"%msg:R,ERE,3,DFLT:^ Invalid.*user ([a-zA-Z]*).* ([0-9][0-9]*[0-9]*.[0-9][0-9]*[0-9]*.[0-9][0-9]*[0-9]*.[0-9][0-9]*[0-9]*).* port ([0-9]*)--end%\"}")
Please note that the template needs to be consistent with the pattern we have identified.
Start forwarding
To start forwarding we now need to restart syslogd: /etc/init.d/rsyslog restart, and check that everything works well: /etc/init.d/rsyslog status
Verify that data flows to Influxdb
Check the socket listener logs
To check the logs execute: kubectl -n logincollector logs -l app=collectorapp
If packets are received from syslogd and stored to the database you should see something like:
Received data: {"username":"b","ip":"xxx.xxx.xxx.xxx","port":"33614"}

Intruder added
Received data: {"username":"teamspeak","ip":"xxx.xxx.xxx.xxx","port":"34994"}

Intruder added
Received data: {"username":"admin","ip":"xxx.xxx.xxx.xxx","port":"62561"}

Intruder added
Received data: {"username":"sftp","ip":"xxx.xxx.xxx.xxx","port":"53614"}
Check the database
- Logon to Influxdb and check if the data gets persisted:
select * from "login-attempts"..geossh
The result should look like:
name: geossh
------------
time                geohash             ip                      port    username        value
1550665352142176076     u09tvnqgx       xxx.xxx.xxx.xxx 33614   b                   1
[...]
1550665718062144620     wx4g0kz6e       xxx.xxx.xxx.xxx 11142   b                   1
Setup the dashboard
Finally we will setup the dashboard in Grafana:
- Create a new dashboard names “Login Attempts”
- Add the World panel and edit it
- Go to [General] and edit the title: “Failed Login Attempts”
- Go to [Metric] and add “InfluxDB” as datasource
- Edit the query to be
SELECT "value" AS "metric" FROM "login-attempts".."geossh" WHERE $timeFilter GROUP BY "geohash" - Set the format to
Table - Go to [Worldmap] and edit the visual options to suit your needs (defaults are fine as well)
- In “Map data options” set “Location data” to
geohash, “Geohash field” togeohash, “Metric field” tometric
Et voila!