Introduction
In the last months I have been dealing with Kubernetes based (micro)services that I could not change, either because they were off-the-shelf or because they had been externally developed. In terms of observability this is a challenge, especially when application metrics are only partially available.
I could have opted for a service mesh, but implementing Istio for an application composed of 20 microservices seemed quite overkill, adding a lot of complexity and cognitive load. So I decided to look for a proxy/reverse proxy that would do the job. My requirements are around gaining visibility based on the RED metrics:
- R: request throughput per second
- E: request error rate, either as throughput or as a fraction of the overall throughput
- D: latency or response time
After looking into different options like nginx (Prometheus exporter) I finally came to the conclusion that Envoy seemed be a good fit:
- it is used in many service meshes like Istio, Consul, Kuma
- it can be statically configured and does not require any other components like a sidecar injector or a control plane
Options I have not looked into (but may in the future):
- likerd2-proxy that is in the core of Linkerd
- Traefik that is in the core of Maesh
All the examples from this post (and more) can be found here on Github.
Metrics
Envoy provides statistics as a tree for each cluster, in different formats like statsd and prometheus. In this post we will keep things simple, and use the Prometheus format.
A few examples:
upstream_cx_total: Total connectionsupstream_cx_connect_fail: Total connection failuresupstream_cx_connect_timeout: Total connections with a connect timeoutupstream_rq_<*xx>: Aggregate response codes, e.g. 2xx, 3xx, etc.
Concepts
Configuration: since we will not implement Envoy with a service mesh we will be using static configurations. Envoy will load these as a yaml-file from a config-map. The Envoy Gitlab repo has many examples of static configurations for different use-cases.
Listeners: define the endpoints for inbound traffic (from Envoy’s perspective) as well as how the traffic will be routed
Clusters: define where outbound traffic will be routed to
A simple example config where Envoy listens on port 10000 and forwards incoming http traffic to localhost:80. The full example can be found here.
apiVersion: v1
kind: ConfigMap
metadata:
  name: envoy-config
data:
  envoy.yaml: |
    static_resources:
      listeners:
      - name: listener_ingress
        address:
          socket_address: { address: 0.0.0.0, port_value: 10000 } # <-- this is the port envoy will listen on
        filter_chains:
        - filters:
          - name: envoy.filters.network.http_connection_manager
            ...
                  routes:
                  - route: { cluster: ingress_service }
                    ...
      clusters:
      - name: ingress_service
        ...
        load_assignment:
          cluster_name: ingress_service
          endpoints:
          - lb_endpoints:
            - endpoint:
                address:
                  socket_address:
                    address: 127.0.0.1 # <-- this is where the traffic will be routed to
                    port_value: 80
Architecture
Traffic
We will add Envoy as a sidecar container:
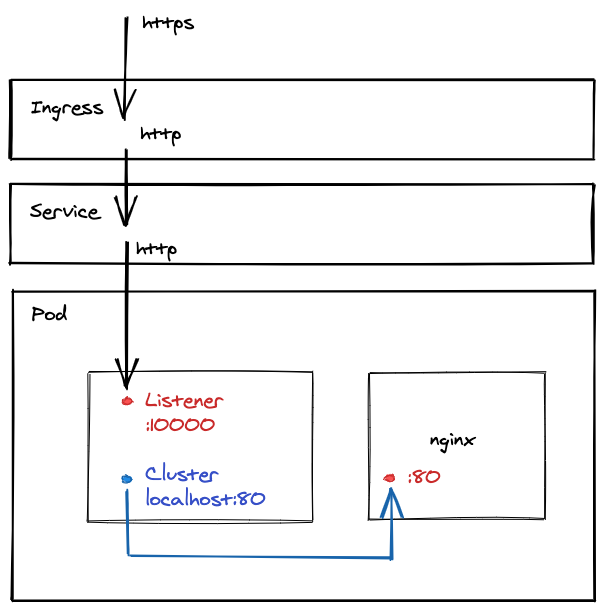
The ingress controller routes incoming traffic to the service, that in turn forwards the traffic to the port Envoy listens on (in this example port 10000). Envoy, based on the config, forwards incoming traffic on port 10000 to localhost:80 (the port nginx listens on).
Exposing metrics
To expose metrics we need to add the admin endpoint to Envoy. The complete example can be found here:
apiVersion: v1
kind: ConfigMap
metadata:
  name: envoy-config
data:
  envoy.yaml: |
    admin:
      address:
        socket_address: { address: 0.0.0.0, port_value: 9901 } # <-- this is the metrics port
    static_resources:
and expose Envoy’s metrics endpoint to Prometheus for scraping (in the service):
kind: List
apiVersion: v1
items:
- apiVersion: v1
  kind: Service
  metadata:
    name: nginx-svc
    annotations:
      prometheus.io/scrape: "true" # <-- for prometheus to scrape
      prometheus.io/path: "/stats/prometheus" # <-- this is the URL envoy exposes metrics on
      prometheus.io/port: "9901"   # <-- this the the port envoy's admin interface listens to (defined in the configmap)
  spec:
    ...
Other examples
The Gilab repo contains the more complex examples that are all based on the same pattern:
- Example 2: contains two listeners, one called
listener_ingressforwarding traffic to the same pod, and one calledlistener_egress_http_httpforwarding traffic to another service running in the same namespace - Example 3: adds two more listeners, one called
listener_egress_http_httpsforwarding incoming http traffic to an external service using https, and one calledlistener_egress_https_passthroughconfigured as an https passthrough proxy - Example 4: extends Example 3 by adding Toxiproxy between Envoy and httpbin. Toxiproxy can then be used to generate chaos (variance in the latency, timeouts) in order to have dashboards showing something representative. A few examples on how to control Toxiproxy can be found in the repo’s README
Dashboards
Since the whole experiment is about observability we finally need something to look at. The dashboard can be found here
Request throughput by latency
This panel shows the requests per second for different slices of response time:
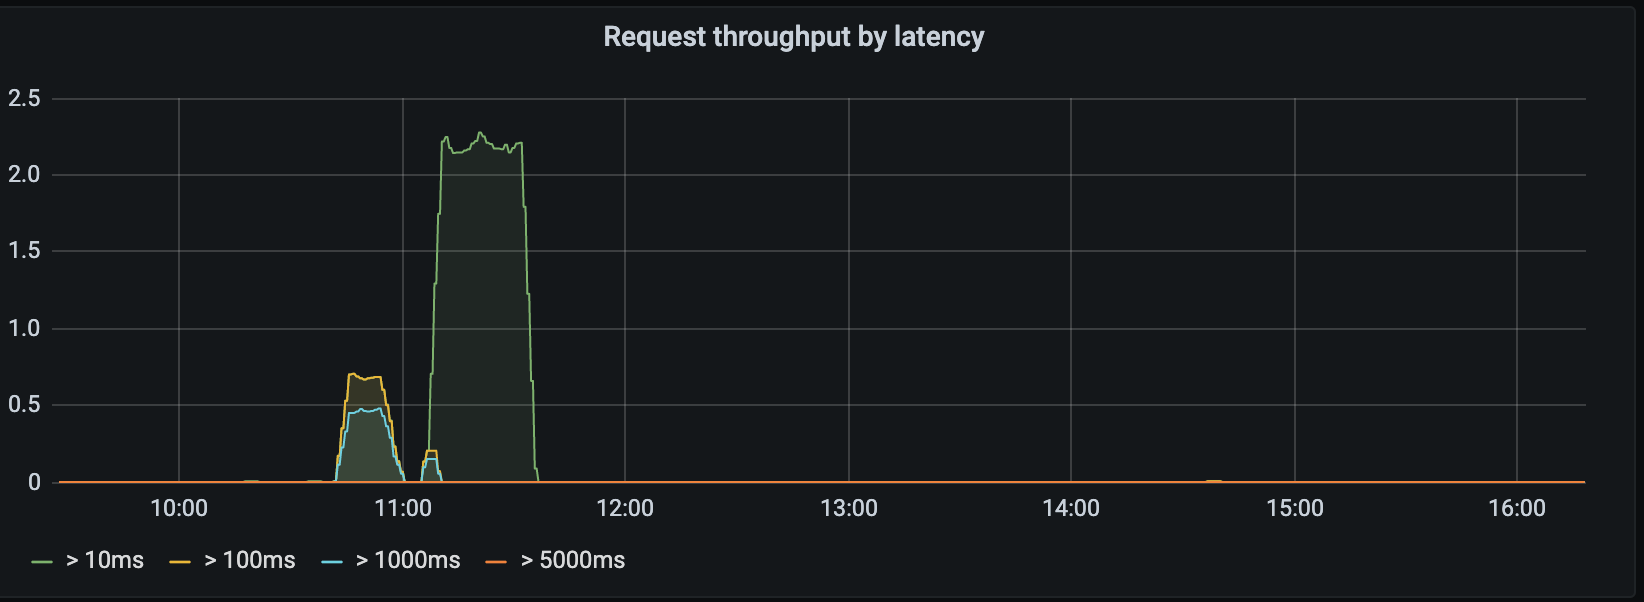
The metrics:
(rate(envoy_cluster_internal_upstream_rq_time_count{kubernetes_namespace="observability",envoy_cluster_name="ingress_service"}[5m]) - on() rate(envoy_cluster_upstream_rq_time_bucket{le="10",envoy_cluster_name="ingress_service",kubernetes_namespace="observability"}[5m]))
(rate(envoy_cluster_internal_upstream_rq_time_count{kubernetes_namespace="observability",envoy_cluster_name="ingress_service"}[5m]) - on() rate(envoy_cluster_upstream_rq_time_bucket{le="100",envoy_cluster_name="ingress_service",kubernetes_namespace="observability"}[5m]))
(rate(envoy_cluster_internal_upstream_rq_time_count{kubernetes_namespace="observability",envoy_cluster_name="ingress_service"}[5m]) - on() rate(envoy_cluster_upstream_rq_time_bucket{le="1000",envoy_cluster_name="ingress_service",kubernetes_namespace="observability"}[5m]))
(rate(envoy_cluster_internal_upstream_rq_time_count{kubernetes_namespace="observability",envoy_cluster_name="ingress_service"}[5m]) - on() rate(envoy_cluster_upstream_rq_time_bucket{le="5000",envoy_cluster_name="ingress_service",kubernetes_namespace="observability"}[5m]))
Request error rate
This graph panel shows the rate of response codes 2xx and 5xx per second:
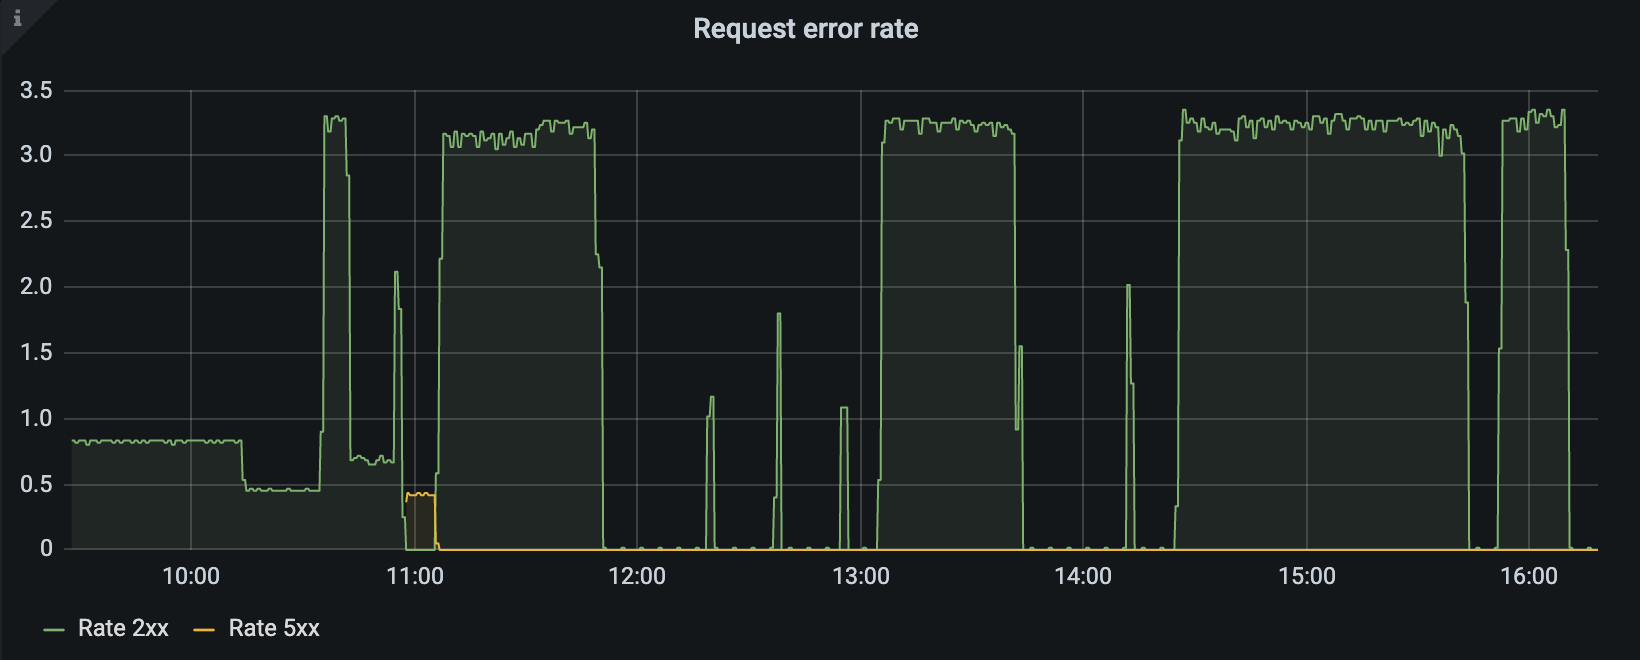
The metrics:
rate(envoy_cluster_internal_upstream_rq_xx{kubernetes_namespace="observability",envoy_cluster_name="ingress_service"}[2m])
Variance in latency
This graph panel shows the rate of requests per second with a latency < 10ms compared to the overall throughput:
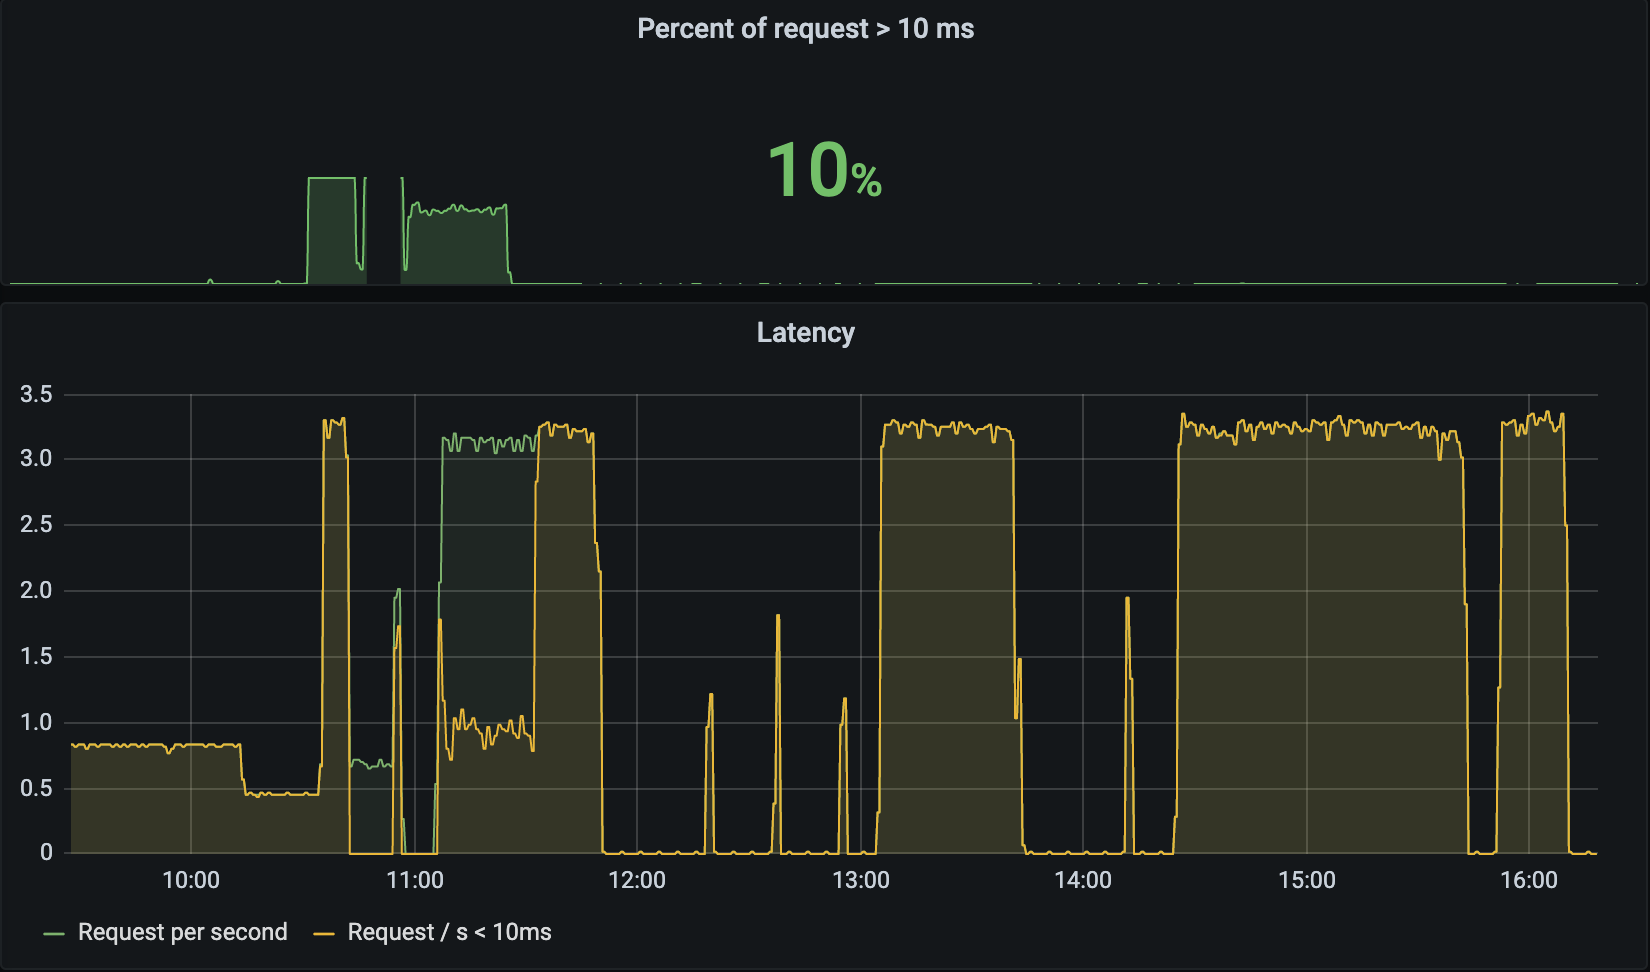
The metrics:
rate(envoy_cluster_internal_upstream_rq_time_count{kubernetes_namespace="observability",envoy_cluster_name="ingress_service"}[2m])
rate(envoy_cluster_upstream_rq_time_bucket{le="10",envoy_cluster_name="ingress_service",kubernetes_namespace="observability"}[2m])
rate(envoy_cluster_internal_upstream_rq_time_count{kubernetes_namespace="observability",envoy_cluster_name="ingress_service"} - envoy_cluster_upstream_rq_time_bucket{le="10",envoy_cluster_name="ingress_service",kubernetes_namespace="observability"}[2m])
Envoy dashboard
This dashboard provides an overview on all the Envoy instances running on a Kubernetes cluster.
Further thoughts
Challenges
I have encountered one issue that I was not able to fix yet: when using Envoy as an https passthrough proxy you expose Envoy on localhost to the application, and configure the cluster to forward to your remote target. Depending on the client, this may cause TLS issues (with SNI). A workaound is to expose Envoy as http and forward the traffic using https; it is not as transparent though.
Scaling-out
Thinking about scaling-out this concept to many microservices, there are some things that can/should be optimized:
- generating Envoy configs
- Mapping and remote targets of your application to local Envoy listeners, and moving the remote target to the Envoy cluster configurations
- Naming listeners and clusters consistenly (e.g. as labels of your pods and/or remote targets) so that they can be dynamically be queried, and stay readable
- Generating Gafana dashboards or populating these dynamically